AI-Assisted Complaint Intelligence

From Customer Complaints to Operational Signals

An end-to-end workflow that turns fragmented customer feedback into structured operational data, shared visibility, AI-supported interpretation and a management brief.

The project did not automate judgement. It automated the distance to it.

The Problem

Feedback existed.
Learning did not.

Customer complaints arrived through calls, WhatsApp messages and informal handoffs.

Individual issues could be resolved quickly.

But once the conversation ended, much of the operational context disappeared with it.

  1. Call
  2. WhatsApp
  3. Informal handoff
Complaint Resolved
  1. Call
  2. WhatsApp
  3. Informal handoff
Pattern Lost

A late delivery, missing item or quality complaint might be handled as an isolated customer-service event.

But without a shared structured history, management cannot easily see whether similar complaints are appearing across the same route, client, process area or period.

A complaint in a conversation is a signal.

A complaint in a system becomes memory.

THE DESIGN QUESTION

How do you turn a complaint into something the operation can learn from?

The goal was not simply to record more complaints.

It was to preserve enough context around each event so individual incidents could become comparable, patterns could become visible, and management could investigate what deserved attention.

01

CAPTURE

What happened?

02

STRUCTURE

Can we compare it?

03

CONNECT

What was happening operationally?

04

INTERPRET

What deserves attention?

05

DECIDE

What should we investigate or change?

The system needed to reduce the distance between an event at the frontline and a useful management question.

The objective was not to automate the decision.
It was to improve what reaches the decision.

01 / Capture

Make the first step
easy enough to happen.

Frontline staff should not need to perform operational analysis while handling a customer complaint.

The capture step was deliberately kept simple: record what happened while the information is still available.

  1. When
    When did it happen?
  2. Client
    Who was affected?
  3. Type
    What was reported?
  4. Severity
    How serious was it?
  5. Detail
    What did the customer actually say?
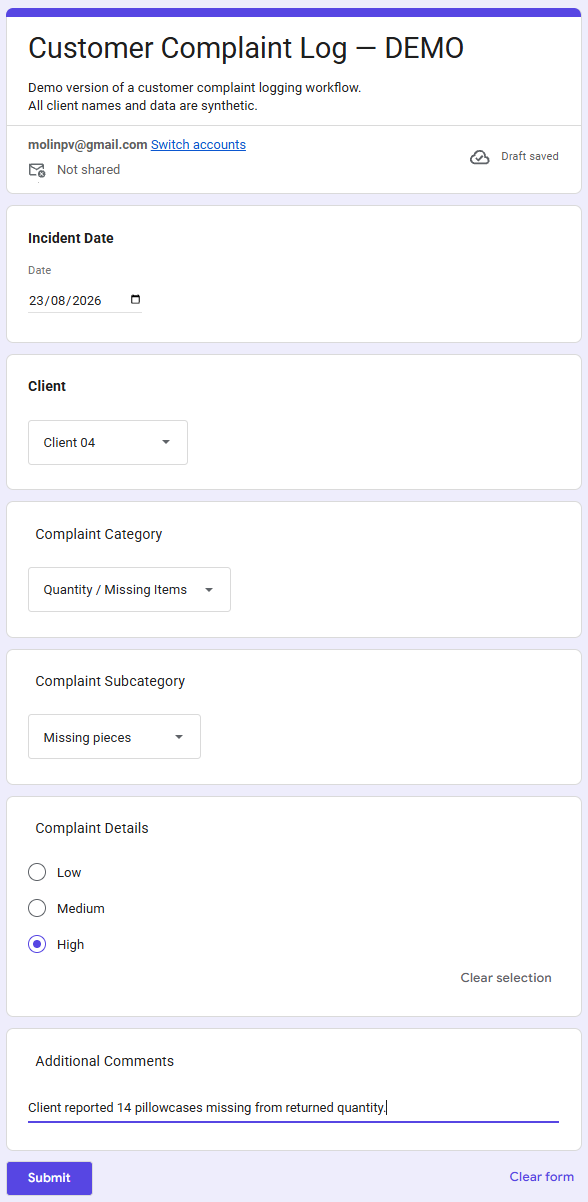
Real Google Form used by frontline staff to log a customer complaint: incident date, client, complaint category and subcategory, severity level, and additional comments.

Capture the event first.
Analyse the pattern later.

02 / Structure

One complaint becomes
one comparable record.

Each submission enters a structured operational dataset. Instead of disappearing into a conversation, the complaint now retains the context needed to compare it with what happened before and what happens next.

Date
Client
Route
Category
Process Area
Severity
Description
Action
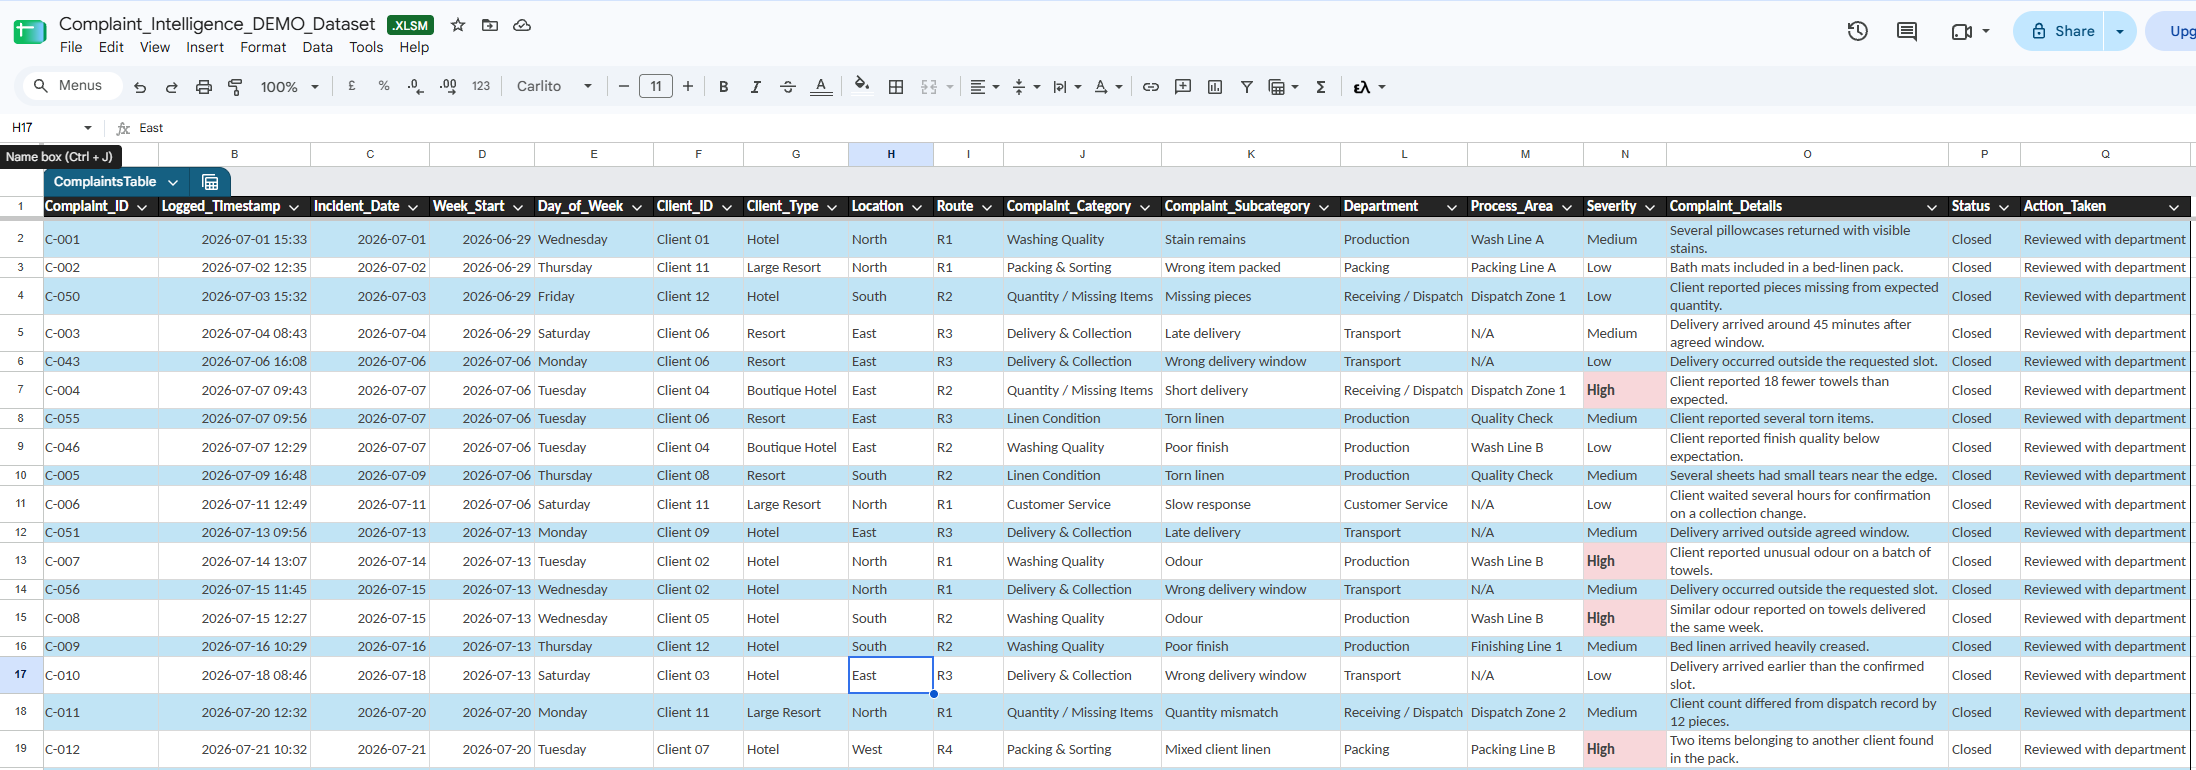
Structured complaint dataset table
Structured complaint history Synthetic customer and operational data

A complaint becomes useful
when it becomes comparable.

03 / Connect

A complaint count
needs context.

Ten complaints do not mean much on their own.

The same number can tell a very different story depending on how much work was processed, which clients were served, and where the incidents occurred.

The complaint history was therefore connected with operational context such as production volume and delivery routes.
Complaint Data
StructuredRecords
ComparableFields
Time-stampedEntries
VerifiedSources
Operational Context
  • Production Volume
  • Route
  • Client
  • Date / Period
Result
A signal
that can be
compared.
01

Raw Count

"How many complaints?"

02

Normalised Signal

"How many relative to the work performed?"

Without a denominator, a number can look important for the wrong reason.

04 / See Operational visibility layer

Power BI shows
what happened.

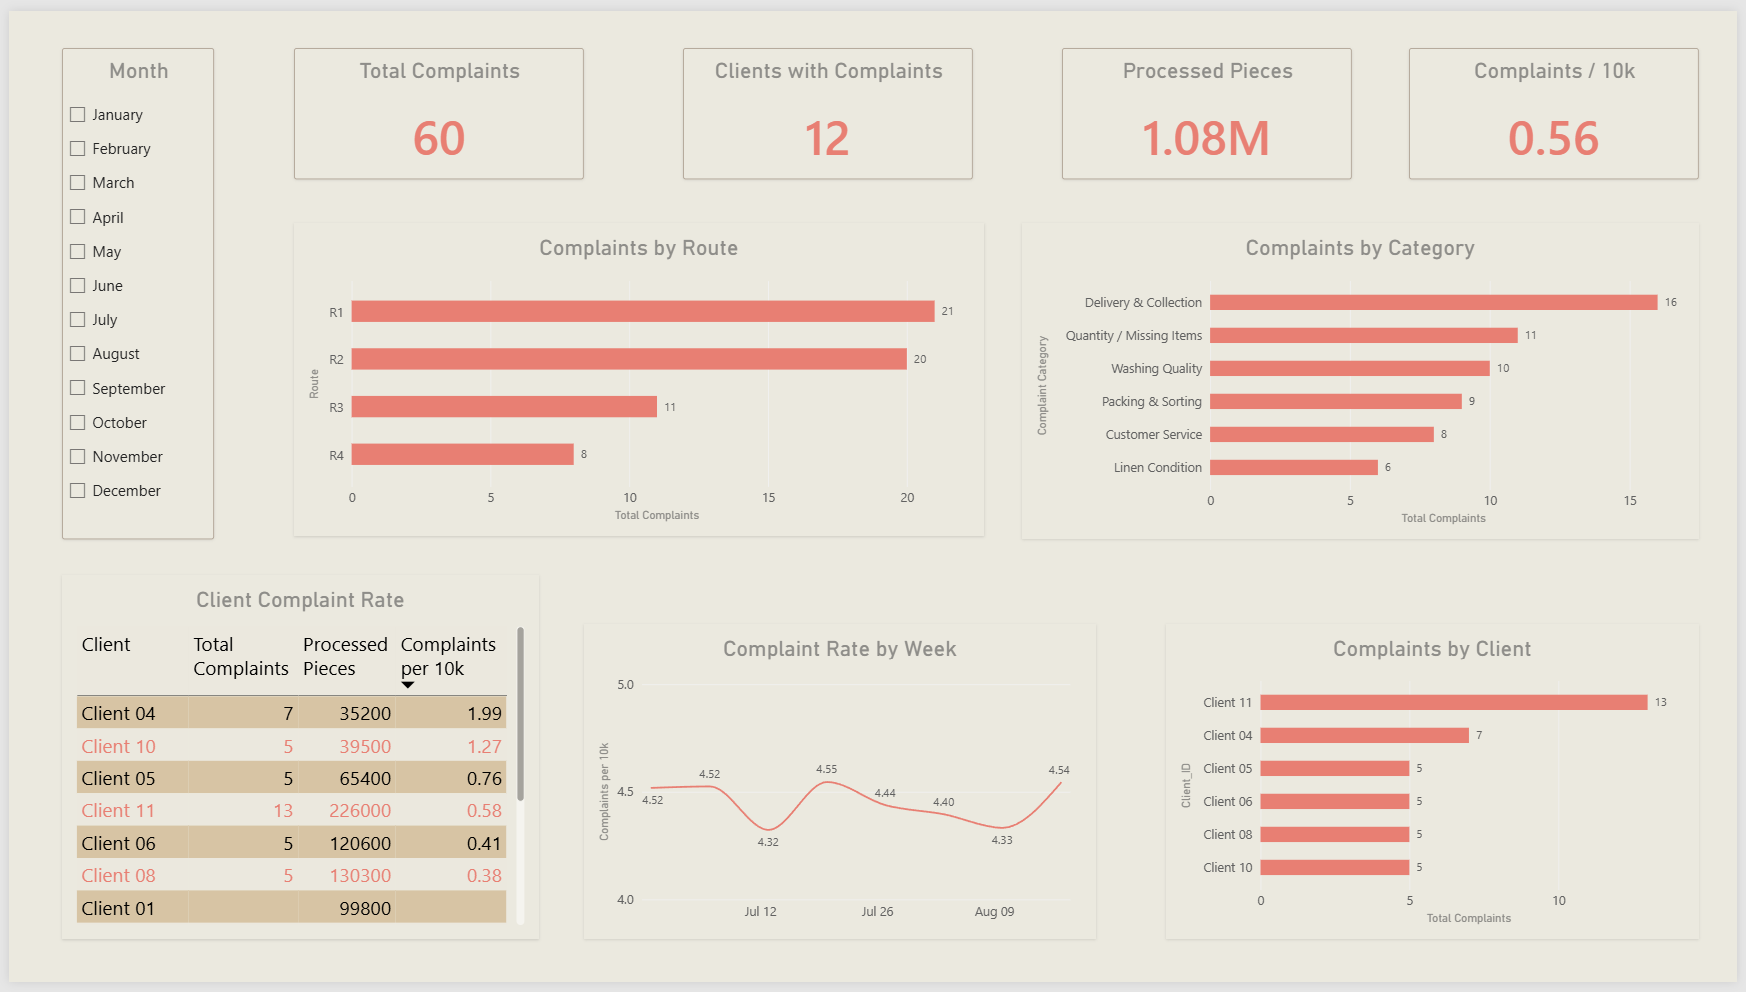
The structured data creates a shared operational view across complaints, clients, routes, categories and production volume.

Instead of reconstructing the story from separate conversations, management can see the same underlying picture.

Operational complaint dashboard Power BI · Synthetic project data

Visibility is not yet interpretation.

A dashboard can show where the signal is.
It cannot establish why it exists.

05 / INTERPRET

AI looks for what
deserves attention.

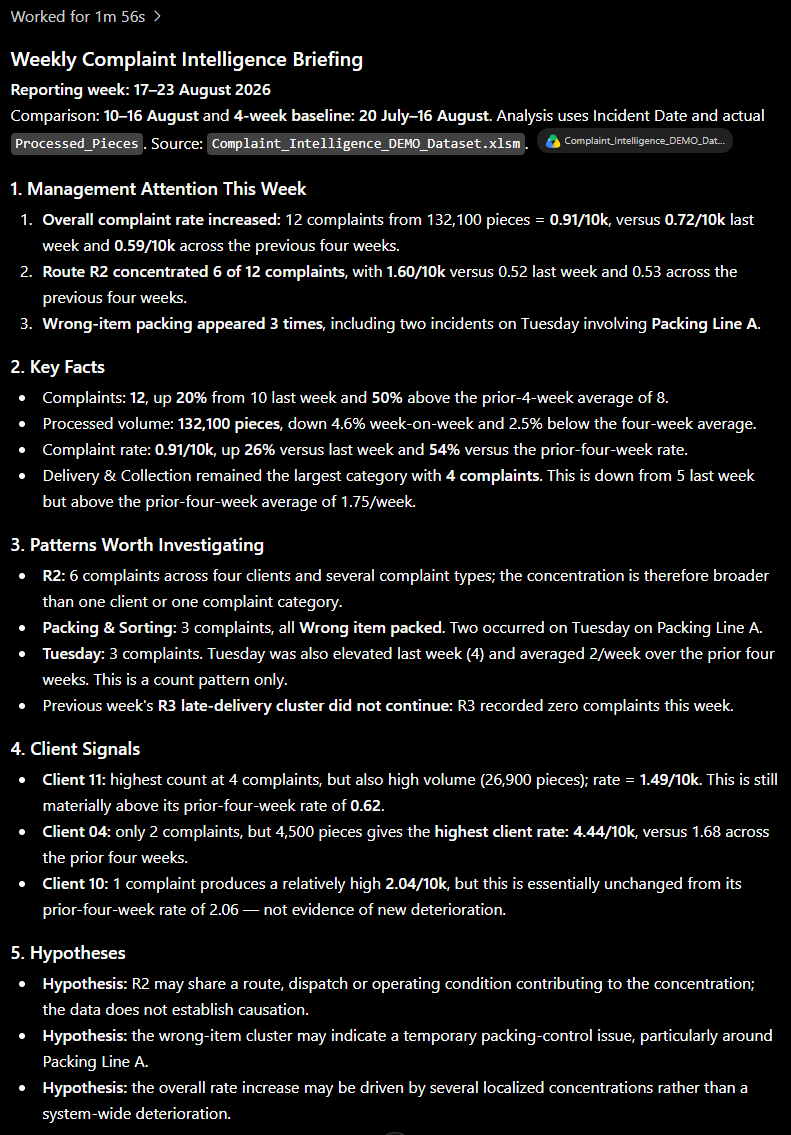
The AI layer analyses structured complaint data together with operational context.

Its role is not to declare a root cause.
Its role is to separate what is known from what may be worth investigating.

  1. I Observed

    What does the data actually show?

  2. II Pattern

    What repeated, concentrated or changed?

  3. III Hypothesis

    What might explain the signal?

  4. IV Investigate

    What should management check next?

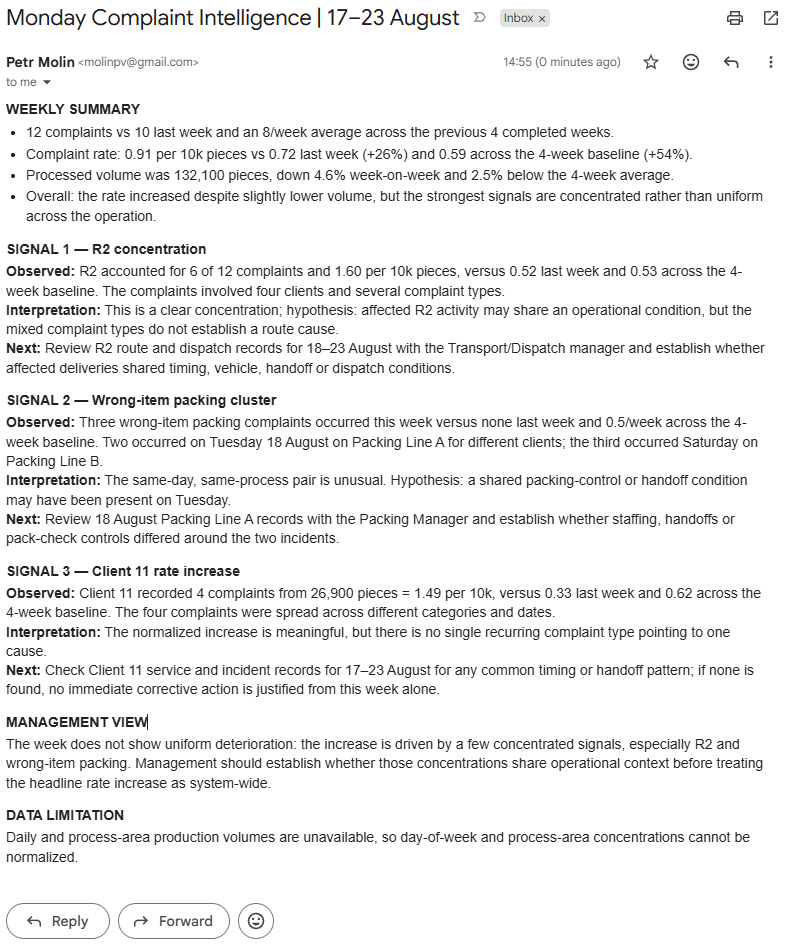
Weekly Complaint Intelligence Briefing produced by the AI interpretation layer — observed management attention items, key facts, patterns worth investigating, client signals and hypotheses for management review.

A pattern is evidence of something to investigate.

It is not proof of root cause.

06 / Decide

The system stops before the decision.

The brief helps management understand:

  1. Q.01

    What changed?

  2. Q.02

    What does the data support?

  3. Q.03

    What may explain it?

  4. Q.04

    What should we check next?

  5. Q.05

    Where is no immediate action justified?

AI shortens the distance from
operational signal to
management judgement.

It does not
replace that judgement.

Sometimes the appropriate outcome is to investigate further, monitor the situation, gather more evidence, or decide that no immediate intervention is justified.

10 The Whole System

Enter once. Analyse automatically. Decide humanly.

Human effort is concentrated at the two ends of the workflow. Frontline staff capture what happened. Management determines what to do about it. Between those points, the information is structured, connected, visualised, interpreted and delivered automatically.

Customer Complaint
01
Capture Google Form
02
Structure Operational record
03
Connect Volume + route context
04
See Power BI
05
Interpret AI analysis
06
Deliver Management brief
07
Decide Human judgement
Human records the event
System reduces the distance
Human investigates and decides
Automation removes the distance. Not the judgement.

What actually changed

We started with complaints. We found an operational sensor.

A customer complaint is not proof of a process failure. But when complaints become structured and are connected across clients, routes, dates, categories and operational volume, they can show management where to start looking.

Customer says

"Something went wrong."

Record shows

What happened.

Pattern shows

Where the signal repeated.

Management asks

What should we investigate?

A complaint is not
root cause.

It is a place
to start looking.

AI can shorten the distance between signal and judgement.

It should not quietly replace the judgement itself.

AI-Assisted Complaint Intelligence

End-to-end operational case study

Built with synthetic customer and operational data